


Enhance Your Dashboard Functionality with Custom LWC Extensions
Use custom Lightning Web Components (LWC) to augment native Tableau Next dashboards with your own custom functionality. With the Dashboard Extension SDK, your custom components interact directly with the data and widgets in your dashboards. Because these extensions inherit global dashboard styling and respond to filter updates, they provide a cohesive and native user experience.
This guide covers implementing and integrating custom LWCs into Tableau Next dashboards with the Component Widget framework.
Prerequisites
- Install VS Code and configure it for Salesforce development. Use these Trailhead modules for installation and configuration:
- Install the Salesforce CLI.
Build Your Custom LWC
Build a custom LWC for your dashboard with this approach.
Decide between hard-coded and dynamic data binding
Your custom LWC references the dashboard data source, either hard-coded or through dynamic data binding. Use dynamic data binding to create a more powerful and flexible dashboard extension.
| Type | Hard-Coded | Data-Bound |
|---|---|---|
| Semantic model | Set in code | Selected by the author |
| Fields | API names set in code | Mapped in the configuration UI |
| Retarget | Edit code and redeploy | Change a property value |
| Use when | One extension serves one model | One extension serves many models or orgs |
Compare hard-coded and dynamic binding
When hard coding, the component owns the binding contract. You create variables for your data source, dimensions, and measures, and then assign static values to these variables.
Hard coding example:
1const DATA_SOURCE = 'Superstore';
2const DIMENSION = 'Orders.Region';
For dynamic binding, the SDK provides well-defined types, SemanticModel, SemanticMeasure, and SemanticDimension, which the dashboard author uses to select the data source, measure, and dimension at runtime. Your component then reads the resolved values from these types.
Dynamic binding example:
1@api sdmName;         // semantic model
2@api measureField;    // measure + aggregation
3@api dimensionField;  // dimension
Create the component
To build a custom LWC, follow the steps in Create a Hello World Lightning Web Component.
Enable the Component Widget
Required metadata
To make your custom LWC visible in the Tableau Next dashboard extension picker, your LWC must include the analytics__Dashboard target in the component metadata file.
1<targets>
2  <target>analytics__Dashboard</target>
3</targets>
Set the LWC’s display name and description, which appear in the extension picker.
1<masterLabel>My Custom Component</masterLabel>
2<description>A unique description for my custom component.</description>
Optional metadata for data binding
To use data binding, declare the data properties in targetConfigs. Set label and description for each property, because these values render in the configuration UI. You must name label by role, such as Group-by Dimension, not by variable name.
When the LWC declares these types, the configuration UI passes an object for each property. Because these object shapes are guaranteed, read the values directly.
The defined data types are SemanticModel, SemanticMeasure, and SemanticDimension.
For a semantic model, the component sets the apiName and id values internally from the configuration UI. Don’t specify these values in the metadata configuration.
The configuration UI adds an aggregation selector automatically for measure fields.
Data type syntax
1type SemanticModel = {
2 apiName: string;   // data source developer name
3 id: string;        // data source ID
4 label: string;     // display name
5}
6
7type SemanticMeasure = {
8 name: string;         // qualified: Table.Field
9 aggregation: string;  // e.g. "Sum"
10 label: string;
11}
12
13type SemanticDimension = {
14 name: string;         // qualified: Table.Field
15 label: string;
16}
Data type example
1sdmName
2 apiName: superstore3
3 id:      2SMUA000000OXXXXXX
4 label:   Superstore
5
6measureField
7 name:        superstore3.Sales134
8 aggregation: Sum
9 label:       Sales
10
11dimensionField
12 name:  superstore3.Region457
13 label: Region
How to use each defined value in your component code:
apiName— pass as the data source name forapplyFilter().name— use in query field expressions. Qualified asModelName.Field; split on the..label— use for display text such as column headers. Don’t derive labels from field names.aggregation— use for aggregating measure values,this.measureField?.aggregation;
Metadata example
1<apiVersion>66.0</apiVersion>
2<targetConfigs>
3   <targetConfig targets="analytics__Dashboard">
4       <property name="sdmName" type="SemanticModel"
5           label="Semantic Model" description="Model to query." required="true"/>
6       <property name="measureField" type="SemanticMeasure"
7           label="Measure" description="Measure to aggregate." required="true"/>
8       <property name="dimensionField" type="SemanticDimension"
9           label="Group-by Dimension" description="Dimension to group by." required="true"/>
10   </targetConfig>
11</targetConfigs>
Deploy your component
Deploy your custom LWC into your org. Use the VS Code palette commands SFDX: Authorize an Org and SFDX: Deploy This Source to Org.
Add Your Custom Component to Your Dashboard
After deploying your custom LWC to your org, add the component to your Tableau Next dashboard. Use the widget configuration to customize the component functionality and dynamically bind to data sources in your org.
Add a widget
-
In Tableau Next, open your dashboard for editing.
-
Click the Extension icon and select an area of the dashboard.

-
Click Add Extension.
-
Select your custom component and click Select.
-
Set properties for the component on the widget panel, or replace it with a different component.
-
Set the widget style on the design panel.
Configure the data bindings in the widget panel
Use the widget panel to bind your data.
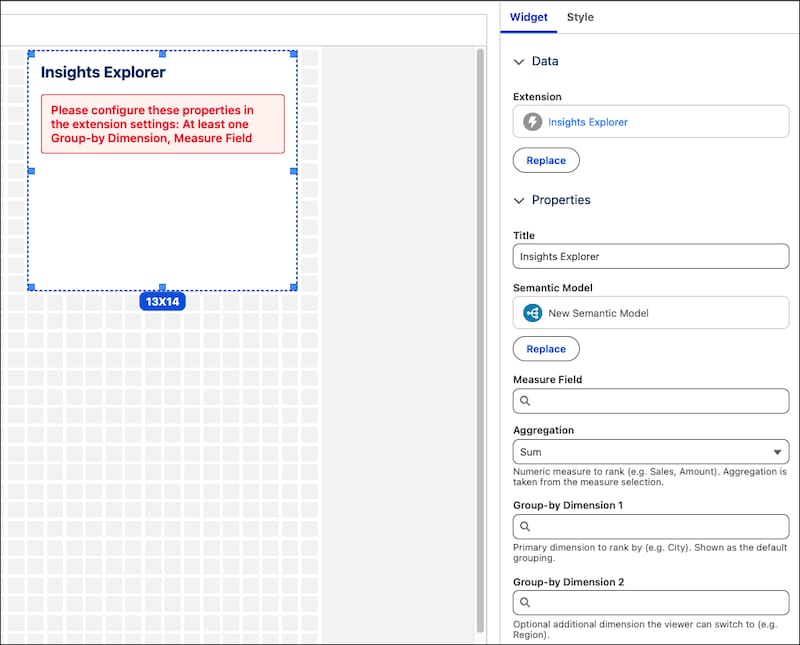
- Select a semantic model.
- Map each measure and dimension property to a field in the selected model.
- If applicable, select the aggregation for any measure fields.
- Save and confirm that the extension renders data.
To retarget the component, select a different semantic model and map the properties, and then save. No redeployment of the component is required.
Use the Dashboard Extension SDK
Pass dashboard filters, parameters, and state to your custom LWC with the Dashboard Extension SDK, so your LWC to interacts with the data in your dashboard.
The Dashboard Extension SDK is the integration layer and secure boundary between the Tableau Next dashboard runtime and custom LWC. Extensions receive the SDK via DashboardWidgetComponentProps and use it to read dashboard context, subscribe to runtime events, and publish filters or parameters.
Get the Dashboard Extension SDK
Each dashboard extension widget automatically includes the SDK. In your component, the SDK is available as the sdk property passed with your widget properties. The constructor registers with the runtime so that when filters or parameters are applied elsewhere on the dashboard, the SDK sends FILTER_CHANGE and PARAMETER_CHANGE events to your subscribers.
API Overview
Context
Retrieve the current dashboard context.
1@returns (Record<string, unknown>)
2getContext()
This method optionally takes the parameters:
currentPage- (string) the name of the current dashboard pagecurrentLayout- (string) the name of the current dashboard layoutdashboardState.filters- (array) a list of the current semantic filtersdashboardState.parameters- (array) a list of the current parameters
Events
Use SDK_EVENTS to subscribe to dashboard runtime events.
| Event | Constant | When Fired |
|---|---|---|
| Filter change | SDK_EVENTS.FILTER_CHANGE | Dashboard filters change |
| Parameter change | SDK_EVENTS.PARAMETER_CHANGE | Dashboard parameters change |
on(eventName, handler) subscribes to an event. Returns an unsubscribe function.
off(eventName, handler) removes an event subscription.
1const SDK_EVENTS = {
2  FILTER_CHANGE: 'filterChange',
3  PARAMETER_CHANGE: 'parameterChange',
4};
FILTER_CHANGE and PARAMETER_CHANGE are fired internally when the runtime invokes the callbacks for setApplyFilter and setApplyParameter, which the SDK registered during construction.
Actions
Extension actions are available in sdk.actions.
applyFilter()
Publish a filter to the dashboard.
sdk.actions.applyFilter(filter)
filter is an object with:
fieldOrFields—string[]for a single field orstring[][]for multiple fieldsvalues—string[]for a single value orstring[][]for multiple values; for values for multiple fields, use an array of value tuplesoperator—stringfilter operator; defaults toIndataSourceName—stringthe optional data source name; defaults to the value fromregisterDataSource
applyParameter()
Publish a parameter for the dashboard to use in a query.
sdk.actions.applyParameter(parameter)
parameter is an object with:
name—stringthe parameter namevalue—stringthe parameter valuedataSourceName—stringthe optional data source name. Specify a data source name or the value fromregisterDataSource.
notifyLifecycleChange()
Notifies when the lifecycle state of the component changes. For each state, add a notifyLifecycleChange() call so the dashboard renders consistently instead of showing a blank widget.
sdk.actions.notifyLifecycleChange(eventName, details?)
eventName — string event name, valid values are:
LIFE_CYCLE_EVENTS.INIT— component initializingLIFE_CYCLE_EVENTS.LOADED— component loaded successfully, query returned successfullyLIFE_CYCLE_EVENTS.ERROR— component is in an error state: query failure or invalid configurationLIFE_CYCLE_EVENTS.NODATA— component query returns no results
details — an object with:
message—stringthe optional event messageerror—stringthe optional error message
Query a bound semantic model
The data shapes for the component metadata are guaranteed, so read the values directly. You don’t have to verify the shape in code, only verify that the required properties are mapped. The properties are undefined until they’re mapped in the extension widget panel.
1get isConfigured() {
2 return Boolean(this.sdmName && this.measureField && this.dimensionField);
3}
4
5get aggregationMethod() {
6 return `SEMANTIC_AGGREGATION_METHOD_${this.measureField.aggregation.toUpperCase()}`;
7}
8
9buildFieldExpression(name) {
10 const p = name.split('.');
11 return p.length === 2
12   ? { table_field: { name: p[1], table_name: p[0] } }
13   : { semantic_field: { name } };
14}
15
16// Query only when isConfigured is true.
17if (this.isConfigured) {
18  const dim = this.dimensionField.name;
19  const msr = this.measureField.name;
20
21  const query = {
22   fields: [
23     { expression: this.buildFieldExpression(dim), alias: dim, rowGrouping: true },
24     { expression: this.buildFieldExpression(msr), alias: msr,
25         rowGrouping: false, semanticAggregationMethod: this.aggregationMethod }
26     ],
27    options: { limitOptions: { limit: 101 } }
28  };
29
30  const rows = await this.sdk.fetchDataUsingQueryAndSource(query, this.sdmName.apiName);
31}
Always set limitOptions.limit, because high-cardinality dimensions can return more rows than an extension can render.
Create filters from a bound field
Use dynamically bound fields to create dynamic filters.
1this.sdk.actions.applyFilter({
2  fieldOrFields: this.dimensionField.name,
3  values: [selectedValue],
4  operator: 'In',
5  dataSourceName: this.sdmName.apiName
6});
React to runtime updates
When using dynamic data binding, re-query to pick up runtime changes to data values. Write code to handle:
- When a bound property changes. Querying only in
connectedCallback()means that the user sees stale data when editing data bindings. - When
FILTER_CHANGEevents occur, so the extension component responds to the dashboard filters, not just the component controls.
Dashboard Extension SDK Example
This example shows how to use the Dashboard Extension SDK in your component JavaScript.
1// In your extension component, define sdk prop as @api.
2// After the extension component is connected, sdk is available for use
3@api sdk;
4
5// Define dynamic data binding properties
6@api sdmName;
7@api measureField;
8@api dimensionField;
9
10// Register the data source that your extension uses or pass dataSourceName on each filter or parameter
11connectedCallback() {
12  // React to filter changes
13  this.unsubscribe = this.sdk.on(SDK_EVENTS.FILTER_CHANGE, (filters) => {
14    // update your UI with filters
15  });
16}
17
18disconnectedCallback() {
19  // Clean up
20  this.unsubscribe();
21}
22
23// Get the dashboard context
24const { currentPage, dashboardState } = this.sdk.getContext();
25
26// Apply a single field filter from the extension to the dashboard (Hardcoded filter value)
27this.sdk.actions.applyFilter({
28    fieldOrFields: 'Account.Type',
29    operator: 'In',
30    values: ['A', 'B'],
31    dataSourceName: 'myDataSDM'
32});
33
34// Apply a parameter
35this.sdk.actions.applyParameter({ name: 'Region', value: 'East', dataSourceName: 'myDataSDM' });
36
37// Report a loaded lifecycle event
38this.sdk.actions.notifyLifecycleChange(LIFE_CYCLE_EVENTS.LOADED);
39
40// Report an error lifecycle event with details
41this.sdk.actions.notifyLifecycleChange(LIFE_CYCLE_EVENTS.ERROR, { message: 'Load failed' });
42
43// Use dynamic values from data binding
44get isConfigured() {
45 return Boolean(this.sdmName && this.measureField && this.dimensionField);
46}
47
48get aggregationMethod() {
49 return `SEMANTIC_AGGREGATION_METHOD_${this.measureField.aggregation.toUpperCase()}`;
50}
51
52buildFieldExpression(name) {
53 const p = name.split('.');
54 return p.length === 2
55   ? { table_field: { name: p[1], table_name: p[0] } }
56   : { semantic_field: { name } };
57}
58
59// Query only when isConfigured is true.
60if (this.isConfigured) {
61  const dim = this.dimensionField.name;
62  const msr = this.measureField.name;
63
64  // Apply dynamic filter
65  this.sdk.actions.applyFilter({
66    fieldOrFields: this.dimensionField.name,
67    values: [selectedValue],
68    operator: 'In',
69    dataSourceName: this.sdmName.apiName
70  });
71
72  const query = {
73   fields: [
74     { expression: this.buildFieldExpression(dim), alias: dim, rowGrouping: true },
75     { expression: this.buildFieldExpression(msr), alias: msr,
76         rowGrouping: false, semanticAggregationMethod: this.aggregationMethod }
77    ],
78    options: { limitOptions: { limit: 101 } }
79  };
80
81  const rows = await this.sdk.fetchDataUsingQueryAndSource(query, this.sdmName.apiName);
82
83  if (rows) {
84    this.sdk.actions.notifyLifecycleChange(LIFE_CYCLE_EVENTS.LOADED);
85  } else {
86    this.sdk.actions.notifyLifecycleChange(LIFE_CYCLE_EVENTS.ERROR, { message: 'Query failed' });
87  }
88} else {
89    this.sdk.actions.notifyLifecycleChange(LIFE_CYCLE_EVENTS.ERROR, { message: 'Configuration failed' });
90}
Generate a Dashboard Extension with an AI Agent
When prompting an AI agent to generate a dashboard extension, include enough detail to avoid common mistakes.
For example, to prevent the agent from hard coding values, specify these directives in your prompts:
- Specify the
analytics__Dashboardtarget, and setmasterLabelanddescription. - Declare
SemanticModel,SemanticMeasure, andSemanticDimensionproperties, and mark required ones. - Read properties as
@apivalues — don’t hard code field API names. - Build the query at runtime from resolved values.
- Show a configuration message when required properties are unmapped.
- Publish selections with
applyFilter.
Review the generated metadata file to confirm property types before deploying.
Verify Dynamic Binding
After deploying your component, verify that the dynamic data binding works as expected.
- Load the extension with no data mapped.
- Select a semantic model and confirm the extension renders the data.
- Select another model with different field names and confirm the updated data renders. This step catches accidental hard coding.
Considerations and Limitations
Each component is responsible for its own internal access checks. If a permission error occurs, the component must notify the dashboard via an event to allow for consistent error propagation.
LWC support on mobile operating systems is limited. Rendering components on mobile devices can cause errors.
For dynamic data binding, keep these points in mind.
- Set the component
apiVersionto 66.0 or later. Earlier versions don’t render semantic property pickers. - Semantic property types require dynamic data binding enabled in the org. Without it, the configuration panel is empty.
- Deleting a bound field from the model leaves the property unresolved. Handle the empty value and remap.
- Renaming or removing a property breaks dashboards that already mapped it. Add new optional properties rather than repurposing existing ones.
- Interactive marks that publish filters must be keyboard operable with ARIA state. Extensions automatically inherit dashboard styling, but not accessibility behavior. Implement keyboard and ARIA support yourself.
Troubleshooting
- Your component isn’t in the extension picker — missing
analytics__Dashboardtarget ormasterLabel. Add both and redeploy. - The configuration panel is empty — data binding unavailable in the org, or the
apiVersionis too low. - Configuration failures after data mapping — a property resolved to an empty value. Make sure to handle both string and object shapes.
- Native visualizations don’t respond to
applyFilter— the field reference ordataSourceNamedoesn’t match the visualization. Log the response and use the qualified field name. - Deployment fails after removing a property — component validation reconciles against the deployed version. Delete the component from the org, and then redeploy.
- Your changes don’t appear after deployment — the old version is cached. Hard refresh, or remove and re-add the extension.
 j
j